
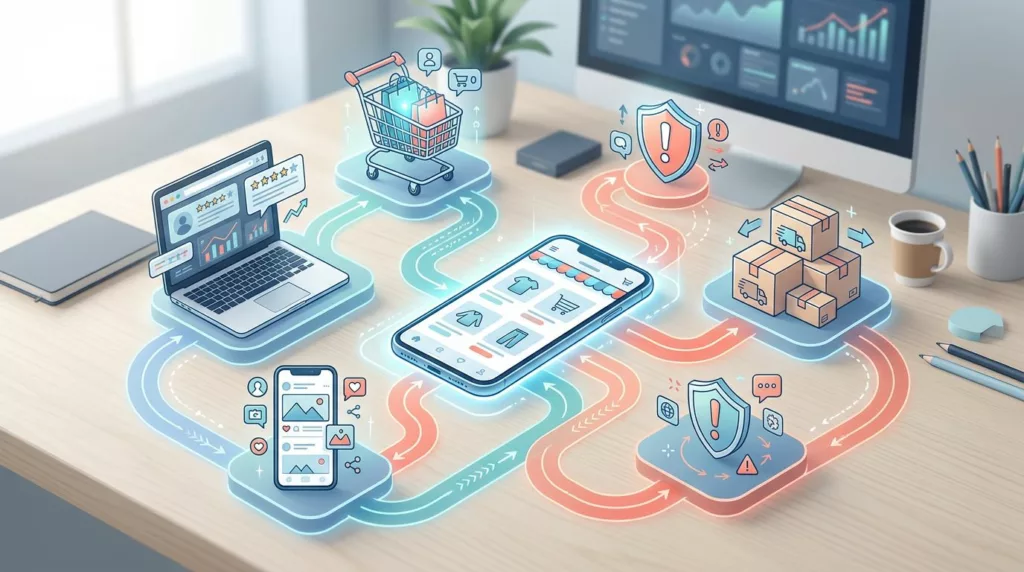
A shopper may discover a product through social media, such as Instagram, compare it across mobile devices, check reviews on a laptop, then abandon checkout after a shipping surprise. An ecommerce customer journey rarely follows a neat line from homepage to purchase.
A useful map helps an omnichannel strategy connect those moments with evidence. It shows what shoppers want, where they hesitate, how the customer experience changes across channels, and what happens after the order arrives. The framework below gives you a practical template for turning journey research into focused conversion experiments.
Key Takeaways
- An ecommerce customer journey is nonlinear, so maps should capture loops, cross-device behavior, customer status, and channel context rather than force every shopper into one funnel.
- Start with one behavior-based segment and document shopper goals, touchpoints, questions, friction, evidence, and business outcomes in a shared working map.
- Combine analytics with recordings, heatmaps, surveys, interviews, usability testing, and support data to distinguish symptoms from causes.
- Turn high-confidence findings into testable hypotheses with a primary metric and guardrail metrics, then update the map after each experiment.
- Include fulfillment, support, returns, retention, and advocacy so post-purchase evidence can improve both the customer experience and the next sale.
What an ecommerce customer journey map should reveal
A customer journey map is a structured view of the customer experience before, during, and after an order. It combines customer goals, customer touchpoints, behavior, questions, friction, and business outcomes such as revenue, completed orders, and conversion rate in one document.
The map should help your team answer four questions:
- What is the shopper trying to accomplish?
- What information or reassurance do they need at each stage?
- Where does the experience slow down or break?
- Which evidence supports a change to the store?
Map stages around shopper questions
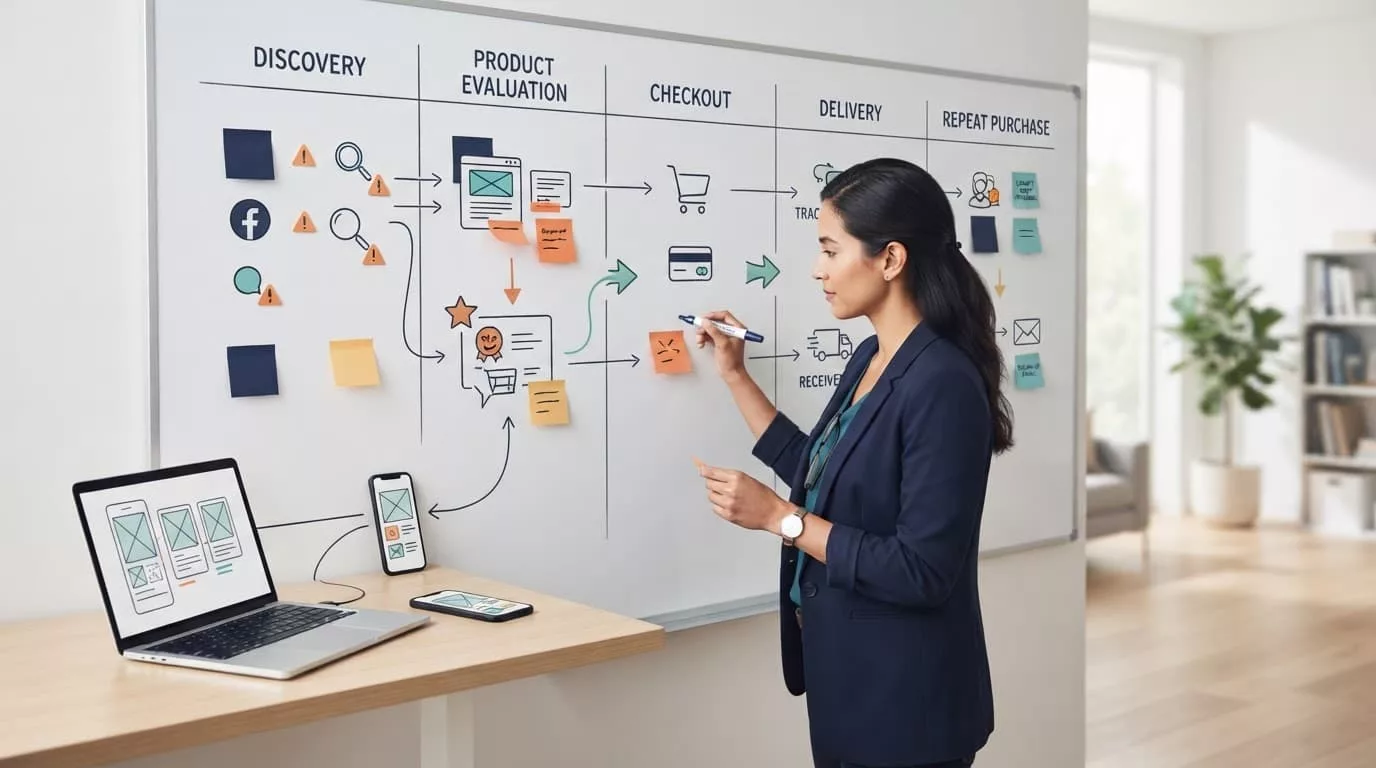
The standard stages provide a useful starting point:
- Awareness stage: The shopper notices a need, product, brand, or recommendation.
- Consideration stage: They compare products, prices, reviews, delivery terms, and alternatives.
- Conversion: They add an item, begin checkout, select fulfillment and payment options, and place the order.
- Retention stage: They receive the product, seek support, reorder, or return to browse.
- Advocacy: They leave a review, recommend the brand, share it on social media, create user-generated content, or refer another buyer.
Some teams isolate a decision stage between evaluation and purchase, when shoppers resolve their final objections.
Each stage contains different questions. During awareness, a shopper may ask whether your brand solves the right problem. On an item page, they may ask whether the item will fit, work, arrive on time, or justify its price. In checkout, the question becomes more practical: “What will I pay, and can I complete this order without trouble?”
Treat the path as nonlinear
A shopper can move backward, skip stages, or repeat the same stage across several devices. A returning customer may go straight from an email to checkout. A first-time buyer may visit an item page seven times before purchasing.
Your map should record these loops instead of forcing every visit into one funnel. Include traffic source, device, customer status, and channel when the data supports those distinctions. Use buyer personas only when they’re grounded in observed behavior, not fictional demographics. For B2B ecommerce, add approval workflows, account permissions, quote requests, tax-exemption checks, and invoice questions.
Start with a research-ready customer journey map
An ecommerce customer journey becomes useful when it describes a defined audience, situation, and measurable problem. Treat the customer journey map as a working research document, since “all customers” is too broad for conversion research.
Choose one shopper segment first
Start with a segment that has a measurable problem. Examples include:
- First-time mobile visitors who view a product but don’t add it to cart.
- Returning customers who begin checkout but don’t complete payment.
- B2B buyers who request quotes but don’t submit purchase orders.
- Customers who contact support before placing a second order.
- Shoppers from paid social campaigns with high product-page engagement and low checkout starts.
Give the segment a practical description based on behavior, not fictional buyer personas. Record the product category, traffic source, device, location, customer status, and purchase context to define the target audience.
A map for a first-time mobile shopper shouldn’t be mixed with a map for a logged-in wholesale buyer. Their goals, constraints, and touchpoints differ.
List customer touchpoints and shopper questions
Add every meaningful interaction, including those outside your website. A typical map may include:
- Search results, social media posts, creator content, and display ads.
- Landing pages, category navigation, site search, filters, and product pages.
- Reviews, comparison tools, size guides, shipping information, and FAQs.
- Cart, guest checkout, payment wallets, delivery selection, and order confirmation.
- Email, SMS, order tracking, returns, customer support conversations, and replenishment reminders.
For each touchpoint, write the shopper’s likely question. Then record the evidence that confirms or challenges your assumption. This prevents the map from becoming a collection of internal opinions.
Ecommerce customer journey mapping template
Copy the table into a spreadsheet or research document, then add rows for important segments, devices, product categories, or behavior-based buyer personas.
Treat this spreadsheet as a first version of the customer journey map, not a fixed funnel.
| Journey stage | Shopper goal | Key touchpoints | Evidence to collect | Primary metric |
|---|---|---|---|---|
| Awareness | Recognize a relevant solution | Search, social, ads, referrals | Landing-page behavior, source data, interviews | Qualified visits |
| Consideration | Compare options and build confidence | Category, search, product page, reviews | Product views, recordings, surveys, support questions | Product-page to cart rate |
| decision stage | Resolve final objections before purchase | Comparisons, delivery details, cart, checkout | Comparison behavior, delivery questions, checkout starts | Checkout starts |
| Conversion | Complete a suitable order | Cart, checkout, payment, delivery | Funnel steps, errors, usability tests | Checkout completion rate |
| Retention | Receive value and decide whether to return | Email, tracking, support, returns | Repeat orders, CSAT, tickets, returns | Repeat purchase rate |
| Advocacy | Share a positive outcome | Reviews, referrals, social posts | Review themes, referral data, UGC | Review or referral activity |
The table works as a starting structure, not a final map. Add columns for customer emotion, friction severity, owner, confidence level, and proposed experiment when your research program grows.
Add the moment before and after each touchpoint
A shopper’s customer experience often depends on what happened immediately before an interaction, so an omnichannel strategy should track entry context across channels. A product page may look clear when reached from a category page, yet confusing when reached from a vague social ad.
Record the entry condition and the next intended action, then shape personalized experiences around the shopper’s intent rather than simply adding more content. For example, a shopper arriving from a comparison article may need proof of compatibility. Someone arriving from a replenishment email may need a fast reorder path rather than a full product education page.
After the touchpoint, record what actually happened. Did the shopper search again, open a size guide, contact support, add to cart, or leave? Those actions give the map a stronger foundation than emotional labels alone.
Combine analytics with qualitative research
No single research method explains an entire ecommerce customer journey. Analytics shows where behavior changes. Qualitative research explains why and gives the customer journey map stronger evidence about customer experience.
Use analytics to locate the break
Start with a basic event and funnel structure. Track product views, internal searches, filter use, add-to-cart events, checkout starts, shipping selections, payment attempts, and purchases.
The GA4 ecommerce events documentation explains how google analytics measures product interactions and transactions. Use the recommended event names where they match your store, then add custom events for issues such as address errors, coupon failures, quote requests, or account-permission blocks.
Segment the funnel by:
- Device and browser.
- New versus returning customers.
- Traffic source and campaign, including paid search, referrals, and social media.
- Product category and price range.
- Customer type, such as retail, wholesale, or logged-in account.
Use buyer personas as hypotheses, not facts. Check them against actual device, source, and funnel data.
A sitewide conversion rate can hide a serious problem in one segment. A payment error affecting mobile Safari users needs a different response from weak product discovery in paid search.
Add recordings and heatmaps
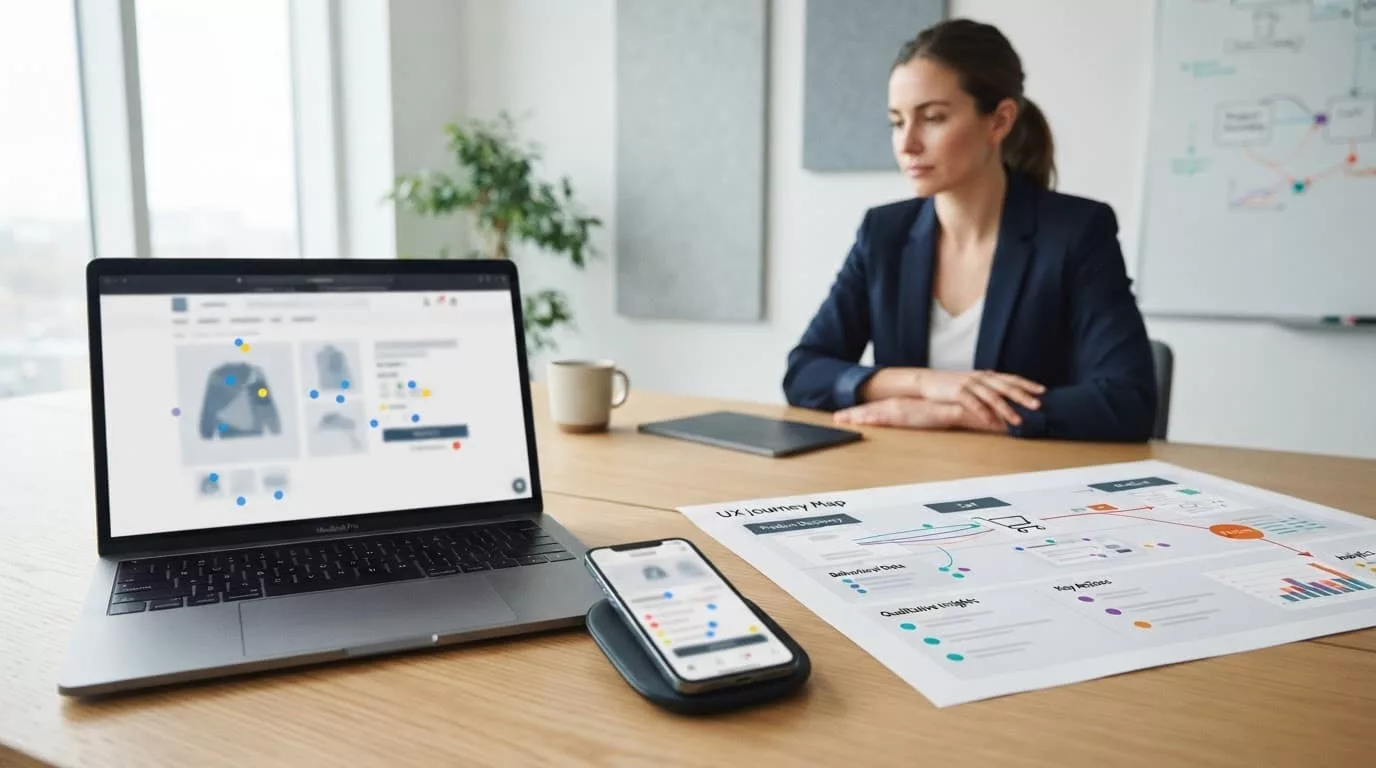
Session recordings can reveal repeated taps, ignored controls, rage clicks, backtracking, and confusion around form fields. Heatmaps can show whether shoppers reach delivery information, product tabs, reviews, or the primary purchase button.
Use ecommerce heatmap and session replay tools to examine high-intent product pages, but review sessions by segment. A recording from a returning desktop customer won’t explain a first-time mobile visitor’s problem.
Hotjar’s explanation of behavior analytics and feedback describes how recordings, heatmaps, and feedback can work together. Treat these tools as sources of clues. Confirm repeated behavior with funnel data before you label it a priority.
Use voices from surveys, interviews, and support
Surveys reveal the language customers use to describe hesitation. Customer feedback from interviews and support conversations adds context. Ask what almost stopped the purchase, what information they expected to find, and what they found confusing. Keep surveys short and tie answers to the relevant product, device, cart, or order.
Interviews offer richer context. Ask participants to describe the last time they bought a similar product, then observe how they complete a real task. Usability testing can expose problems with search, filters, product information, account requirements, delivery choices, and payment errors. This ecommerce usability testing guide provides a practical way to separate discovery tasks from checkout tasks.
Use customer support data as another important source. Tag tickets and chat conversations by journey stage. Search for repeated questions about sizing, compatibility, delivery dates, returns, invoices, tax exemptions, and payment failures.
Turn journey friction into conversion research
An ecommerce customer journey map becomes valuable when each problem leads to a decision. Avoid vague observations such as “the page feels confusing.” Describe the behavior, context, and business consequence.
Separate symptoms from causes
Suppose analytics shows a high exit rate on a product page. That is a symptom, not a diagnosis. Recordings, customer feedback, and support tickets help distinguish symptoms from causes. Recordings might show shoppers opening the shipping accordion, while support tickets reveal that delivery dates are unclear. Interviews might show that buyers don’t understand whether the product fits a particular use case.
These findings point toward different changes:
- Move delivery timing near the price and purchase control.
- Add a compatibility explanation beside the product specifications.
- Show a clearer returns summary before shoppers add the item.
- Improve the connection between ad promises and landing-page content.
Give each finding a confidence level. High-confidence findings appear across multiple sources or affect a large, clearly defined segment. Low-confidence findings can still become research questions, but they shouldn’t receive the same priority as repeated evidence.
Write a testable experiment hypothesis
A useful hypothesis connects a customer problem to measurable behavior at the decision stage, when a shopper resolves an objection or commits to buying:
If we show the estimated delivery date beside the add-to-cart button for mobile shoppers, product-page to cart rate will increase because visitors can judge delivery fit without opening another section.
The hypothesis identifies the audience, change, expected behavior, and reason. Define the primary metric before launch. Add guardrail metrics to catch harmful effects, such as refunds, support contacts, discount use, payment failures, or average order value.
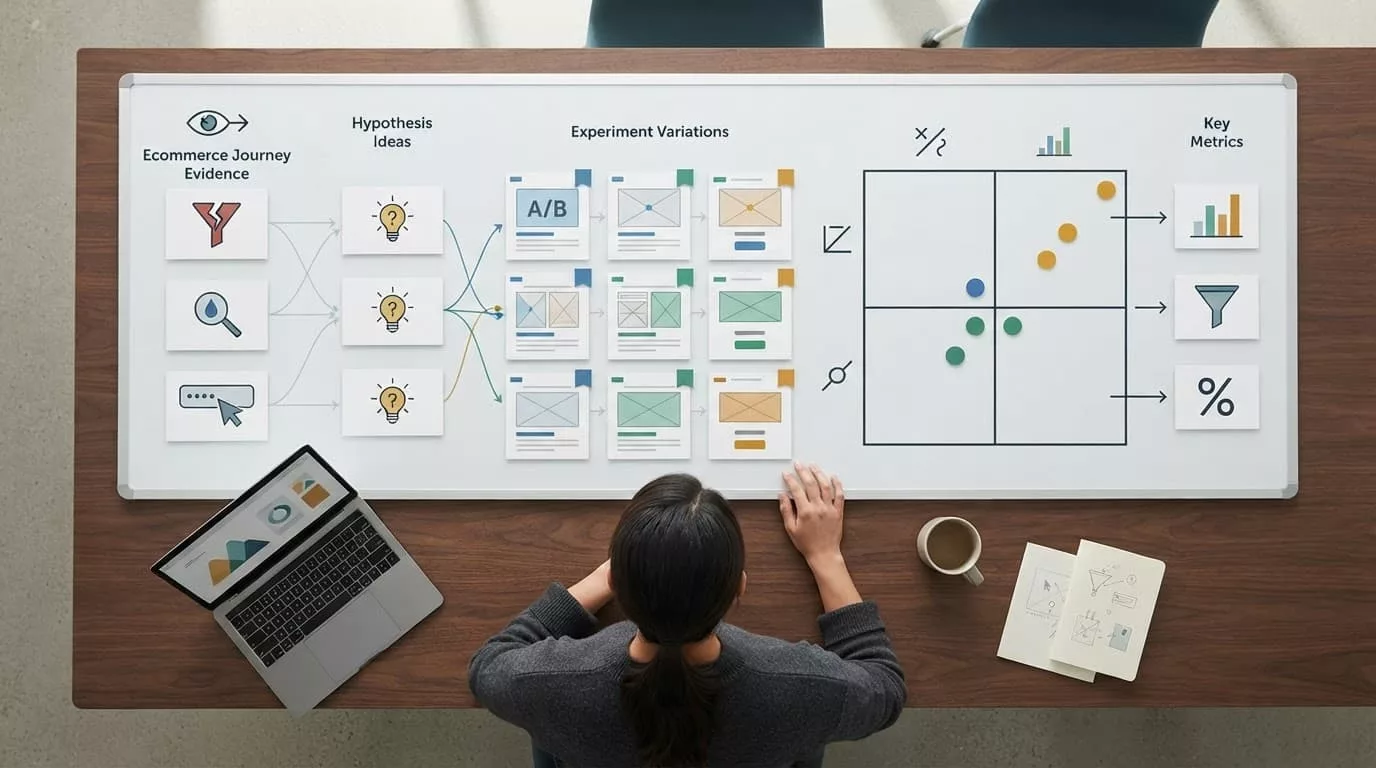
Use a simple prioritization score based on evidence strength, affected traffic, business impact, and implementation effort. The score helps teams compare ideas, but it doesn’t replace judgment. A small error in the checkout process may deserve urgent attention because it blocks the entire order.
Measure the journey without losing the revenue link
Every stage of the ecommerce customer journey needs a metric tied to the shopper’s goal and resulting customer experience. Avoid judging the awareness stage with purchase rate alone, or retention with email opens alone.
Choose metrics for discovery and conversion
Discovery metrics for the awareness stage can include qualified sessions, branded search activity, landing-page engagement, and new-user conversion by source. These measures help compare traffic quality, conversion rate, and business value rather than reward volume.
Consideration metrics show whether shoppers can evaluate products during the consideration stage. Track internal search success, filter use, item-page engagement, review interaction, add-to-cart rate, and pre-purchase questions.
Conversion metrics should follow the complete checkout process:
- Cart-to-checkout rate.
- Checkout step completion.
- Shipping and payment error rate.
- Guest versus account checkout completion.
- Wallet usage and payment success.
- Completed orders and revenue per session.
Use Google Analytics recommended events as a reference when designing your event plan. Validate the data against orders in your commerce platform. A clean-looking dashboard isn’t useful if purchases, refunds, or cross-device sessions are recorded incorrectly.
Track retention and advocacy as journey outcomes
The retention stage starts with fulfillment, not email marketing, because opens alone don’t explain whether customers will return. Track delivery issues, returns, support contacts, and usage questions. Also track repeat purchase rate, time between orders, customer retention, and customer lifetime value.
Customer satisfaction scores can show whether an interaction met expectations. Net Promoter Score can capture willingness to recommend. Neither metric explains the cause on its own, so connect the response to order type, product, channel, delivery experience, and support history.
Customer advocacy measures include review volume, review sentiment, referral activity, repeat user-generated content, and customer mentions. A customer who leaves a five-star review but contacts support twice for an unresolved issue tells a different story from a customer who reviews after a smooth delivery.
Use the map to reduce cart abandonment
Baymard’s checkout research reports a global average cart abandonment rate of 70.19% in its current dataset. Treat that figure as context, not as a target benchmark for your store. Within the broader ecommerce customer journey, checkout is the decision stage where final objections, costs, and trust concerns affect commitment. Your own funnel, segmented by device and customer type, gives you the better starting point.
Diagnose checkout drop-off by step
Map every action in the checkout process, including address validation, shipping selection, coupon entry, login prompts, payment authorization, and confirmation. Measure where shoppers stop and what errors appear.
Then compare the failing step with qualitative evidence. A shipping step may lose shoppers because costs appear late. A payment step may fail because a wallet button doesn’t load. An account step may create friction because first-time customers must create a password before seeing delivery options.
For practical examples, review these checkout UX fixes and connect each proposed change to step drop-off, field errors, or completion rate.
Test small changes before redesigning checkout
Low-cost experiments can answer important questions:
- Does showing guest checkout earlier improve completion for new customers?
- Does displaying delivery timing before payment reduce exits?
- Does autofill work correctly on mobile devices and the highest-volume browsers?
- Do express payment options help low-value carts or only repeat buyers?
- Does a clearer error message help shoppers recover without contacting support?
Test one meaningful change at a time when possible. Compare whether a shorter or clearer checkout process improves completion. Compare results by device, traffic source, order value, and new versus returning status. Track refunds and support contacts alongside conversion, because a higher order count can hide a worse shopping experience.
Connect post-purchase evidence to the next sale
The ecommerce customer journey continues beyond the confirmation page. Your customer journey map should record delivery, support, and repeat-purchase evidence. This evidence often reveals the information gap that blocked the first order or damaged the customer experience afterward.
Build retention loops from real behavior
Treat fulfillment, setup, returns, and replenishment as part of the retention stage. Send useful follow-up messages through email marketing, creating personalized experiences based on the order and the customer’s likely next need. A replenishment reminder fits a consumable product. A setup guide fits a complex product. A return-status update fits a customer who has already contacted support.
Use product category, purchase history, delivery status, and support reason to shape each message. Avoid sending a discount when the customer is still waiting for an answer about a damaged order. Repeat orders can support customer retention, but they don’t prove brand loyalty. Reviews, referrals, and user-generated content on social media can encourage customer advocacy.
Post-purchase surveys can ask what almost stopped the purchase and whether the product matched expectations. They can also measure customer satisfaction and identify missing information. These post-purchase survey questions work best when you connect customer feedback to funnel behavior and order data.
Use automation to support, not block, customers
Artificial intelligence (AI) and automation can classify support intent, suggest answers, identify repeated friction, and route urgent cases. Common categories include order status, return eligibility, product compatibility, invoice requests, and payment problems.
Keep a clear path to human customer support when the issue involves money, cancellation, damaged goods, account access, or a failed resolution. Review automated answers for accuracy and measure resolution rate, repeat contacts, escalations, and satisfaction. A fast wrong answer creates another journey problem.
Run a lightweight mapping workflow
A small team can improve an ecommerce customer journey with a useful first map, without buying an enterprise analytics platform.
Gather the minimum evidence set
Choose one segment and collect:
- A funnel report covering the main journey steps.
- Ten to twenty relevant session recordings, grouped by device or problem.
- Recent customer feedback from surveys, interviews, or usability sessions.
- Support conversations tagged by journey stage.
- A short list of business outcomes, such as revenue, margin, repeat orders, or support cost.
The exact sample depends on traffic and problem size. The goal is to compare evidence sources, not to create a statistically perfect portrait from a handful of sessions.
Document findings in one shared sheet
Treat the shared sheet as the working customer journey map. Create columns for segment, stage, touchpoint, shopper goal, observed behavior, customer quote, evidence source, friction, metric affected, confidence, proposed change, owner, and status.
Write findings as observable statements. “Mobile visitors opened delivery information but rarely returned to the purchase control” is useful. “Mobile UX is poor” is too broad to guide a test.
Review the sheet with marketing, product, design, engineering, customer support, and operations. Compare buyer personas with observed behavior and agreed segment definitions. B2B teams should include sales or account-management staff when quotes, approvals, invoices, or tax documentation appear in the journey.
Turn the map into a research backlog
Rank issues by how clearly they affect a revenue step, how often the behavior occurs, how severe the blockage is, and how easy it is to investigate. Start with a question that can change a decision.
For example, if shoppers abandon after selecting a delivery method, test whether the cost, timing, or service limitations cause the problem. A short intercept survey may answer the question faster than a full redesign.
After each experiment, update the map. Record the result, affected segment, metric movement, guardrail effects, and remaining uncertainty. The map should become a working record of customer evidence, not a presentation that goes stale after one meeting.
Frequently Asked Questions
What is an ecommerce customer journey map?
An ecommerce customer journey map is a structured view of the customer experience before, during, and after an order. It connects shopper goals, touchpoints, behavior, friction, customer feedback, and business outcomes in one working document.
Which stages should an ecommerce customer journey include?
Most maps include awareness, consideration, decision, conversion, retention, and advocacy. The exact stages can vary, but the map should reflect how shoppers actually move between questions, channels, devices, and purchases.
What research should be used to build the map?
Combine funnel and event data with session recordings, heatmaps, surveys, interviews, usability testing, and customer support conversations. Analytics shows where behavior changes, while qualitative research helps explain why.
How can a journey map improve conversion rate optimization?
Use the map to connect a specific shopper problem with a measurable experiment, such as clarifying delivery timing or improving a checkout step. Track the primary conversion metric alongside guardrails such as refunds, support contacts, payment failures, and average order value.
Should the journey map include post-purchase behavior?
Yes. Delivery, returns, support, repeat purchases, reviews, and referrals reveal whether the customer experience met expectations and can identify information gaps that affected the first order.
Conclusion
A strong ecommerce customer journey map connects shopper intent with observed behavior and measurable outcomes. It accounts for how shoppers move through the buying process and what happens after purchase.
Start with one segment, combine analytics with customer evidence, and describe friction in terms that lead to a test. Evidence-led mapping improves the customer experience when each finding points to a metric and a clear next question. This makes conversion research easier to prioritize and helps post-purchase insights shape the next purchase.