

Your ecommerce repeat purchase rate is the percentage of paying customers who place at least two qualifying orders within a defined period. Cohort analysis makes that number more useful by grouping customers around their first purchase and comparing their behavior after equal amounts of time.
An overall rate can look healthy while most new buyers never return. The second purchase reveals whether recent acquisition efforts bring customers who stick around.
Start with a consistent formula, then apply it to equally mature customer cohorts.
Key Takeaways
- Count unique paying customers, not orders or account registrations.
- Group customers by first qualifying purchase, then count repeat customers within fixed windows.
- Compare cohorts at the same age, with customer counts beside percentages.
- Judge improvement alongside contribution margin, returns, and support demand.
Define Ecommerce Repeat Purchase Rate Consistently
The repeat purchase rate formula (also called the repurchase rate) is:
Repeat purchase rate = (customers with more than one purchase / total purchasing customers) x 100
Both counts must use the same reporting period and purchase rules.
Count customers, not transactions
A repeat customer has two or more qualifying purchases. Someone with ten orders contributes one customer to the numerator, just like someone with two.
The denominator is the total number of customers with at least one qualifying purchase. Account-only sign-ups don’t belong there.
Exclude cancelled, refunded, or returned orders from qualifying purchases. Also document a minimum gap, such as 24 to 48 hours, so split checkouts and same-day add-on orders don’t automatically count as repeat behavior. Apply that behavioral filter consistently.
Calculate an overall rate first
Across 12 months, 750 repeat buyers among 2,500 purchasing customers produce:
750 / 2,500 x 100 = 30%
That describes purchasing activity within those 12 months. It doesn’t necessarily describe the percentage of newly acquired customers who returned.
Returning-customer reports may classify buyers using purchases before the selected period. Record that distinction before comparing a dashboard’s returning customer rate with your calculation.
Calculate Repeat Purchases by Acquisition Cohort
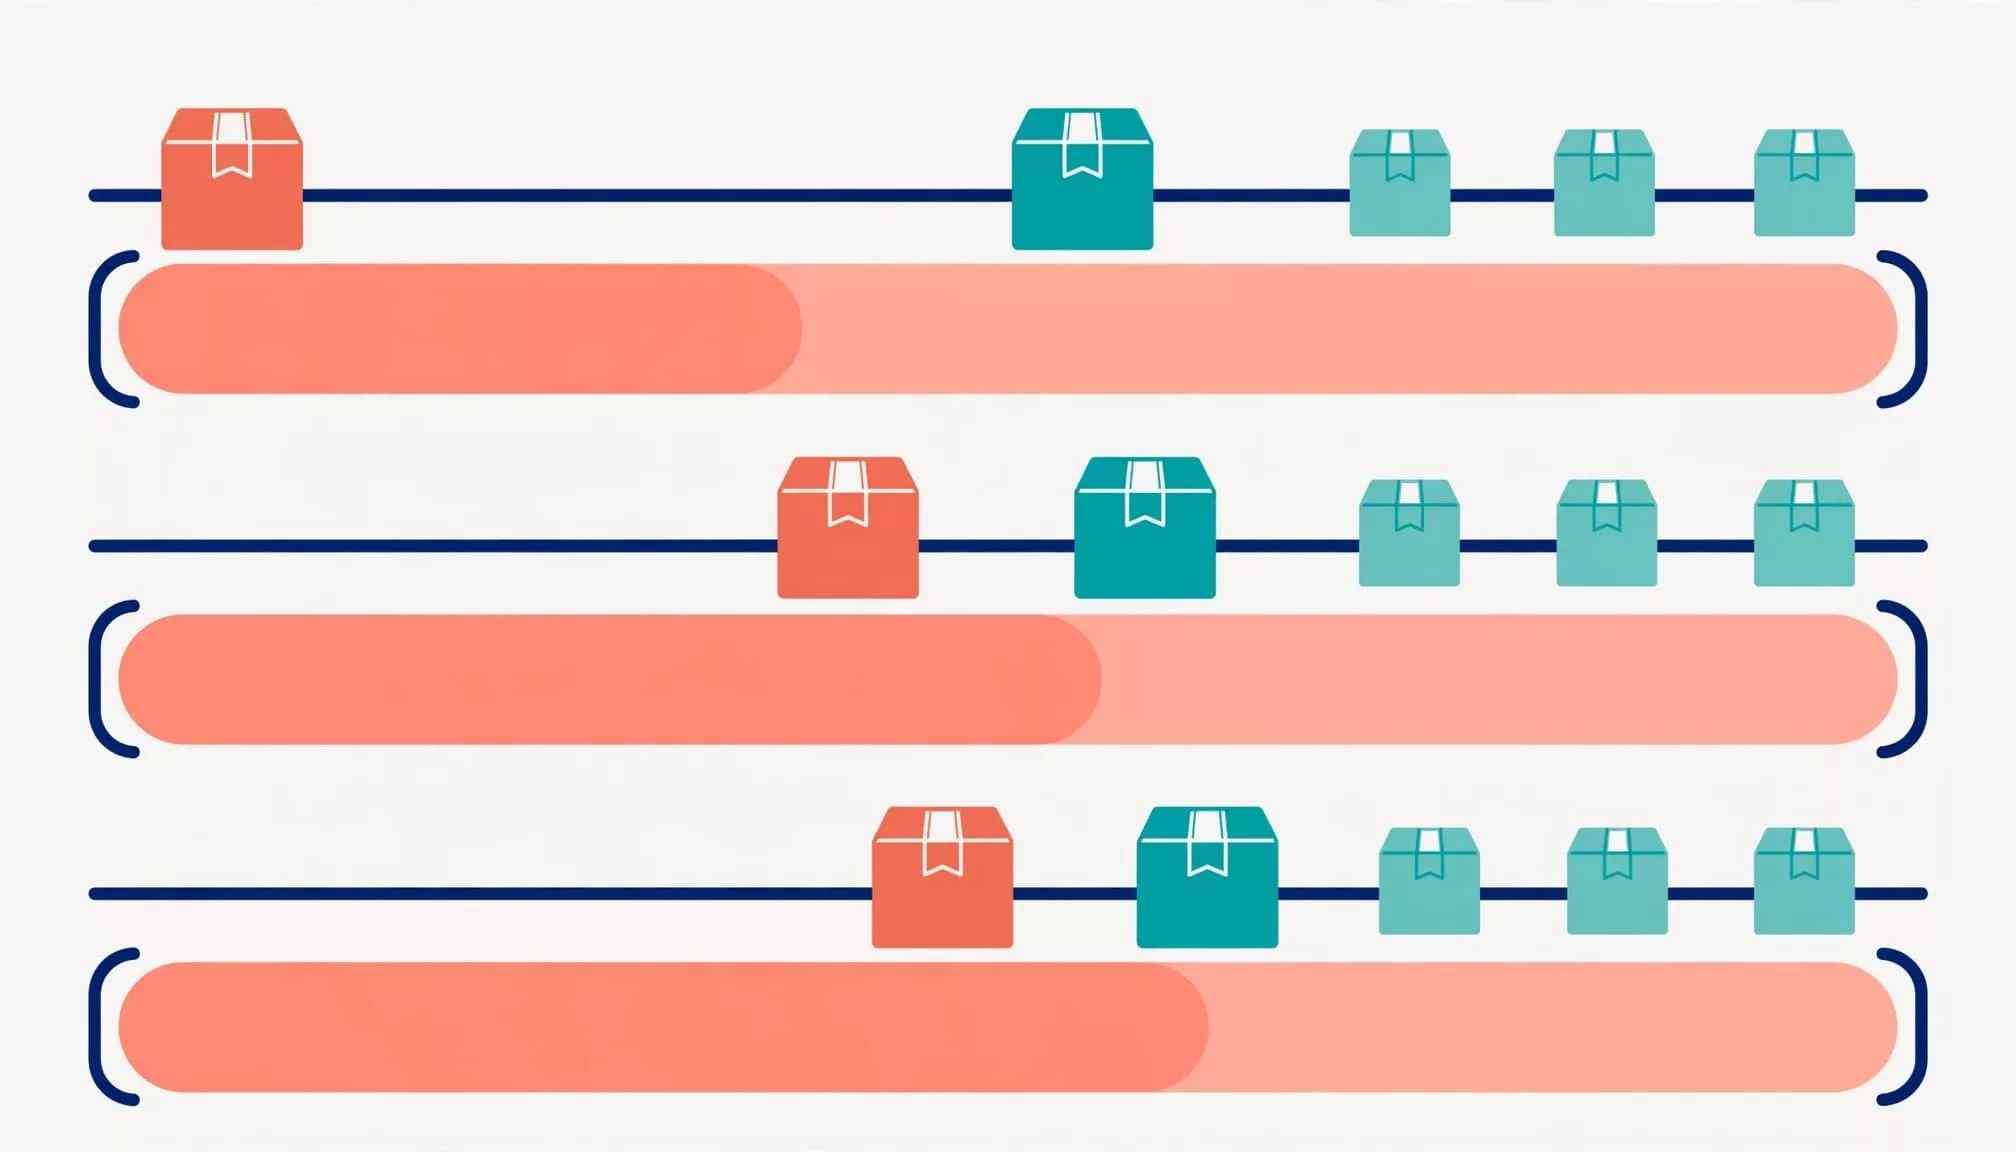
An acquisition cohort groups customers by their first purchase date. RetentionX’s customer cohort documentation uses this approach to compare purchasing behavior over time.
1. Assign each customer a first-purchase period
Export customer ID, order ID, purchase timestamp, order status, refund status, and acquisition source where available.
Find each customer’s earliest qualifying purchase across their complete history. Then assign a first-purchase month, such as January.
Keep that membership fixed. Customers remain in January’s cohort even when they buy again in March. Use stable customer identifiers to reconcile guest checkouts and account purchases without merging unrelated shoppers.
2. Measure cumulative repeat buying
For each customer, start the clock at their first qualifying purchase. Count whether another qualifying purchase happens within 30, 90, or 180 days.
For each window, count unique repeat customers once, even if they place several additional orders.
The cohort formula becomes:
Cohort repeat purchase rate = (cohort customers who repeat within N days / original cohort customers) x 100
This worked table uses cumulative repeat buyers, not orders placed in each calendar month.
| First-purchase cohort | Customers | Repeat by day 30 | Repeat by day 90 |
|---|---|---|---|
| January | 500 | 100 (20%) | 200 (40%) |
| February | 1,000 | 180 (18%) | 350 (35%) |
| March | 250 | 60 (24%) | 100 (40%) |
January’s 90-day calculation is 200 / 500 x 100 = 40%. March reaches the same rate with fewer customers, while February produces more repeat buyers but a lower percentage.
Compare Cohorts Over Equivalent Time Windows
Calendar totals and customer-age windows answer different questions. Mixing them creates misleading comparisons.
Allow every customer the full observation period
A customer acquired yesterday hasn’t had 90 days to return. Comparing that customer with someone acquired six months ago penalizes the recent cohort.
An immature cohort isn’t evidence of churn. Report its result as incomplete, not as a churn rate, until every first-time buyer has the full observation window.
For replenishable products, shorter windows can reveal useful movement. Furniture and other infrequent purchases need longer observation. Use the distribution of days between first and second orders to choose windows, while remembering that non-repeaters won’t appear in that distribution.
Keep denominators and definitions stable
Don’t remove non-repeaters from the original cohort denominator. Changing cohort sizes can otherwise manufacture an apparent improvement.
When combining cohorts, add customer counts before dividing. The table’s combined 90-day rate is 650 / 1,750, or 37.1%, rather than the unweighted average of 38.3%.
Separate purchases under a subscription model from discretionary orders when their buying patterns differ. Keep purchase exclusions, minimum gaps, and time zones consistent. A new refund policy or identity-matching rule can change the reported rate without changing customer behavior.
Treat Category Benchmarks as Directional
Published benchmarks disagree because their purchase definitions, observation periods, and customer populations differ.
These commonly quoted ranges illustrate that disagreement.
| Category | Count.co estimate | Radiant estimate |
|---|---|---|
| Fashion or apparel | 20% to 30% | 20% to 40% |
| Beauty | 25% to 35% | Not specified |
| Electronics | 15% to 25% | 10% to 25% |
| Furniture | Not specified | 5% to 15% |
The takeaway is the spread, not a universal target. These benchmarks alone don’t establish customer satisfaction or customer loyalty. They show repeat buying, not how customers feel or why they return. Radiant also labels rates below 20% problematic and rates above 40% excellent. Those labels aren’t useful without a matching category and timeframe.
Alexander Jarvis cites an ecommerce average of 28% and roughly 20% for tea shops. His reference to Alex Schultz describes 20% to 30% returning monthly, which isn’t comparable with an annual repeat rate.
Radiant, citing Statista, also reports roughly 45% progressing to a second order, 62% to a third, and 81% at the fifth-order stage. Later-stage figures concern different customer bases, not increasing shares of the original acquisition cohort.
Your strongest benchmark is a previous, equally mature cohort with a comparable acquisition channel and first-purchase category. Compare discount-acquired customers separately when promotion usage materially changes buying behavior. Compare word-of-mouth marketing cohorts when cohort sizes and customer mix are sufficiently comparable.
Find the Drop-Off Between Orders One and Two
A high overall rate can hide weak new-customer retention. RetentionX warns that a 70% repeat customer rate can coexist with losing 70% of customers after their first purchase because established buyers dominate the active customer base.
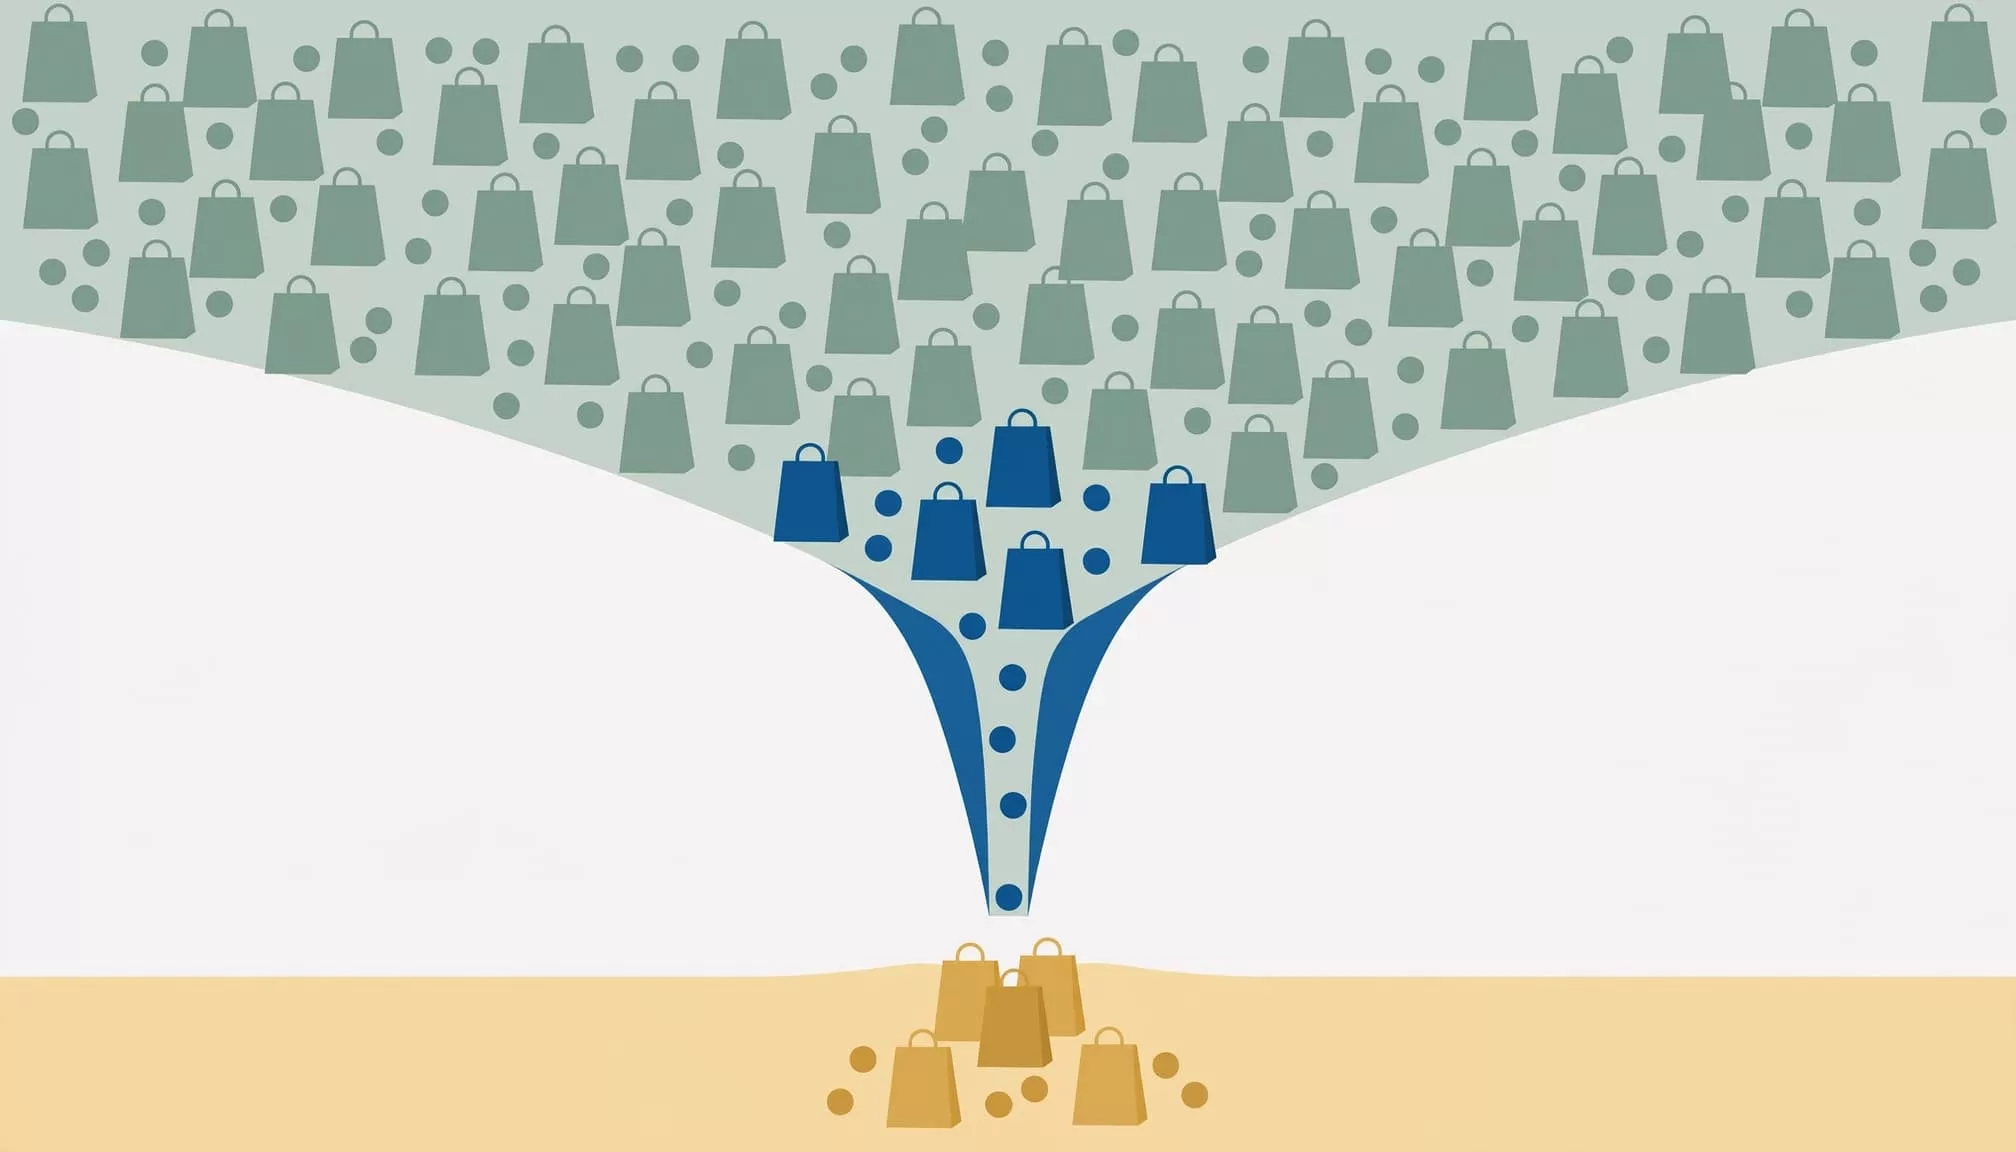
Measure first-to-second-order conversion using the original cohort denominator. Then measure second-to-third conversion among customers who reached order two. Give each stage an equivalent follow-up window starting at the relevant order.
In its repeat purchase analysis, RetentionX reports 20% higher average order value among existing customers, with the biggest increase between orders one and two. It also reports a roughly 60% higher probability of a third order than a second, and 40% lower return and cancellation rates among existing customers.
These are reported findings, not forecasts for every store. Likewise, Radiant’s often-cited acquisition-cost multiple of five to seven times retention cost isn’t a budget rule. Bain’s retention economics associates a 5% retention increase with profit gains of 25% to 95%, not a guaranteed outcome.
Pair repeat purchasing with contribution margin. Better retention improves future economics; it doesn’t retroactively reduce historical customer acquisition cost.
Prioritize Tactics That Earn a Profitable Second Order
Use cohort evidence to choose the intervention. A low repeat rate alone doesn’t identify whether the problem is product quality, delivery, timing, or acquisition mix.
- Repair the first-order experience. Compare delivery exceptions, return reasons, and customer service contacts among repeaters and non-repeaters to identify customer experience issues. Resolve damaged-order complaints through customer service before sending another promotion. Our ecommerce customer journey guide connects these post-purchase touchpoints.
- Match follow-up to product use. Send setup guidance for complex products. Use email marketing to send replenishment reminders for consumable products. Base timing on observed reorder intervals rather than a universal 30-day schedule.
- Reduce the work of reordering. Link to the purchased variant, show availability clearly, and make delivery charges visible. Surface relevant customer reviews and user-generated content to answer purchase questions. A returning shopper shouldn’t need to reconstruct the previous order.
- Test incentives after useful reminders. Compare a relevant recommendation or loyalty program benefit with a discount. Use a holdout where volume permits, and measure incremental repeat purchasing after the same observation window.
- Segment follow-up by behavior. Our ecommerce RFM segmentation guide separates recent, frequent, and lapsed buyers. Their messages shouldn’t be identical, so tailor follow-up with personalized recommendations.
For every test, track contribution after discounts, shipping subsidies, returns, and support costs. Higher average order value or more repeat orders can still produce less profit. Also monitor unsubscribe rates so short-term demand doesn’t exhaust your audience.
FAQ
Is repeat purchase rate the same as customer retention rate?
No. Repeat purchase rate measures customers reaching another purchase under defined rules. Customer retention rate generally measures how many existing customers remain active across periods, excluding newly acquired customers.
In non-subscription ecommerce, “active” needs an explicit definition. Neither metric proves brand loyalty, and neither replaces customer lifetime value or contribution analysis.
Where can Shopify merchants find returning-customer data?
Open Analytics in Shopify’s admin sidebar for the returning customer rate graph and reporting tools. Shopify’s customer reports include first-time versus returning customer views.
Use those reports for an activity baseline. For acquisition-cohort analysis, group buyers by their first qualifying purchase and calculate elapsed time from that purchase. A calendar-period chart doesn’t automatically provide equal follow-up for every customer.
Make the Cohort Comparison Your Retention Baseline
A useful ecommerce repeat purchase rate starts with consistent definitions and equal observation windows. Keep the original cohort denominator, show customer counts, and separate first-to-second-order performance from later purchasing.
Then judge each improvement by profitable repeat demand. A stronger percentage matters when customers return without discounts, returns, or support costs erasing the gain.