

Calculate ecommerce gross margin after discounts by subtracting COGS from net sales, then dividing gross profit by net sales. Discounts reduce net sales immediately, while product costs usually stay unchanged, so profit can fall faster than revenue.
A 20% discount on a $100 product with $60 COGS cuts gross profit in half. Start with the discounted selling price, then separate merchandise profit from the expenses that still need funding.
Key Takeaways
- Calculate gross margin using sales after discounts, refunds, and credits.
- Keep merchandise costs separate from fulfillment, payment fees, acquisition, and overhead unless your accounting policy classifies them within COGS.
- Evaluate promotions using gross profit dollars and contribution margin, because higher sales don’t guarantee higher profit.
Calculate Ecommerce Gross Margin After Discounts
Enter net sales and COGS
Your calculator needs two core inputs: net sales and the cost of goods sold associated with those sales.
Net sales = gross product sales minus discounts, refunds, and credits.
Gross profit = net sales minus COGS.
Gross margin (%) = gross profit ÷ net sales × 100.
Shopify’s gross margin definition uses the same distinction: gross profit is a dollar amount, while gross margin expresses it as a percentage.
At business level, AdBeacon’s example uses $100,000 revenue and $60,000 COGS. That produces $40,000 gross profit and a 40% gross margin.
Compare full-price and discounted results
This calculation shows what happens when the selling price falls but COGS stays unchanged.
| Calculator input or result | Full price | 20% discount |
|---|---|---|
| Original price | $100 | $100 |
| Discount | $0 | $20 |
| Net sales | $100 | $80 |
| COGS | $60 | $60 |
| Gross profit | $40 | $20 |
| Gross margin | 40% | 25% |
The discount removes $20 of revenue and $20 of gross profit. However, the margin falls by 15 percentage points, because the denominator also changes.

Use $80 as revenue when entering this sale into a calculator. Don’t enter $100 and treat the discount as another product cost, or subtract the discount again afterward.
Choose Cost Inputs Without Double-Counting
Include the merchandise costs of units sold
For purchased inventory, start with supplier cost and any landed costs your accounting policy assigns to inventory. These can include inbound freight, import duties, and preparation required to make goods saleable.
For manufactured goods, COGS can include materials, direct production labor, and allocated production overhead.
Match costs to units sold, rather than subtracting every inventory purchase made during the month. Inventory still on the shelf hasn’t generated the sales you’re measuring.
Also, don’t add inbound freight separately when your landed unit cost already includes it. Use the relevant inventory cost for each SKU rather than one storewide estimate.
Keep other expenses visible below gross profit
Marketing spend, general staff salaries, software, rent, and administrative overhead come after gross profit.
For a merchandise-focused calculator, track shipping costs, pick-and-pack charges, payment processing fees, and marketplace commissions separately. Financial statements may classify some fulfillment expenses within COGS, so keep the definition consistent across periods.
Shopify’s profit margin calculator calculates gross margin from product cost and selling price. Its result doesn’t establish net profit after overhead, marketing, shipping, and other selling expenses.
Gross margin helps assess merchandise pricing. Contribution margin and net profit answer the next questions.
Use Calculator Results to Set Promotion Limits
Distinguish gross margin from markup
Margin divides gross profit by selling price. Markup divides the same profit by cost.
For the $100 product costing $60, gross margin is 40%, while markup is $40 ÷ $60, or 66.7%.
Similarly, a 30% markup produces a 23.1% margin. Confusing the two can leave much less room for discounts than expected.
To calculate a price for a target gross margin:
Required net selling price = COGS ÷ (1 minus target margin as a decimal).
At $60 COGS and a 25% target margin, the required net price is $80.
Calculate the volume a discount must deliver
The earlier promotion cuts gross profit per unit from $40 to $20. Therefore, you need twice as many units just to preserve gross profit, assuming unchanged unit costs.
Selling 100 units at full price generates $4,000 gross profit. Selling 130 discounted units generates only $2,600, despite a 30% increase in volume.
Our guide to measuring incremental revenue from promotions connects that volume lift with the profit sacrificed on purchases that would have happened anyway.
A promotion can increase orders while reducing total gross profit, even before campaign and fulfillment costs enter the calculation.
Calculate What Remains for Overhead and Acquisition
Spread fixed costs across realistic sales volume
Consider the $10 sock with $6 COGS. Each pair generates $4 gross profit before other costs.
With $2,000 in fixed overhead costs, selling 1,000 pairs leaves $2,000, or $2 per pair. Selling 500 pairs leaves nothing. At 1,200 pairs, the remainder is $2,800 total, approximately $2.33 per pair.
These unit economics assume no other expenses. The simplified break-even volume is $2,000 ÷ $4, or 500 pairs. Add variable selling costs, and the required volume rises.
Fixed-cost allocation also explains the $1 product costing $0.50 with $5 total fixed SG&A. Selling one unit produces a $4.50 loss. Across 1,000 units, that same $5 leaves $0.495 profit per unit before other expenses.
Compare CAC with contribution, then consider payback
At $100 revenue and $70 gross profit, a $40 customer acquisition cost leaves $30 before other costs. With only $30 gross profit, the same CAC creates a $10 shortfall before fulfillment or payment fees.
For paid campaigns, ROAS compares attributed revenue with ad spend. POAS compares gross profit tied to ad-attributed orders with ad spend. Use first-party attribution consistently because attributed sales aren’t automatically incremental.
Our ecommerce contribution margin calculator brings those variable expenses into the calculation.
For example, the $64 order model uses $18 product cost, $6 fulfillment, $2.20 payment fees, $5 shipping subsidy, and $12 acquisition cost. It leaves $20.80 contribution, or 32.5%.
Some sellers accept an initial loss to acquire repeat buyers. Judge that decision using expected lifetime contribution and payback time. Repeat orders need to repay acquisition spending after their own costs.
Reconcile Returns Before Comparing Sales Channels
Reverse refunded revenue and recoverable inventory correctly
A returned order can erase revenue and add return postage, inspection, restocking, or disposal costs.
Reduce net sales for the refund. Then account for recovered inventory at its appropriate cost value. Don’t treat the item’s original retail price as recovered profit.
Also, separate refunded revenue from reverse-logistics expenses. Recording the refund as both lost sales and another fulfillment charge counts the same loss twice.
Compare results after similar return windows. Fresh promotional orders can look stronger than older orders whose refunds have already arrived.
Compare channel contribution alongside merchandise margin
An owned store, marketplace, and direct-order channel can sell the same product at similar gross margins. Their payment, commission, fulfillment, and acquisition burdens can differ substantially.
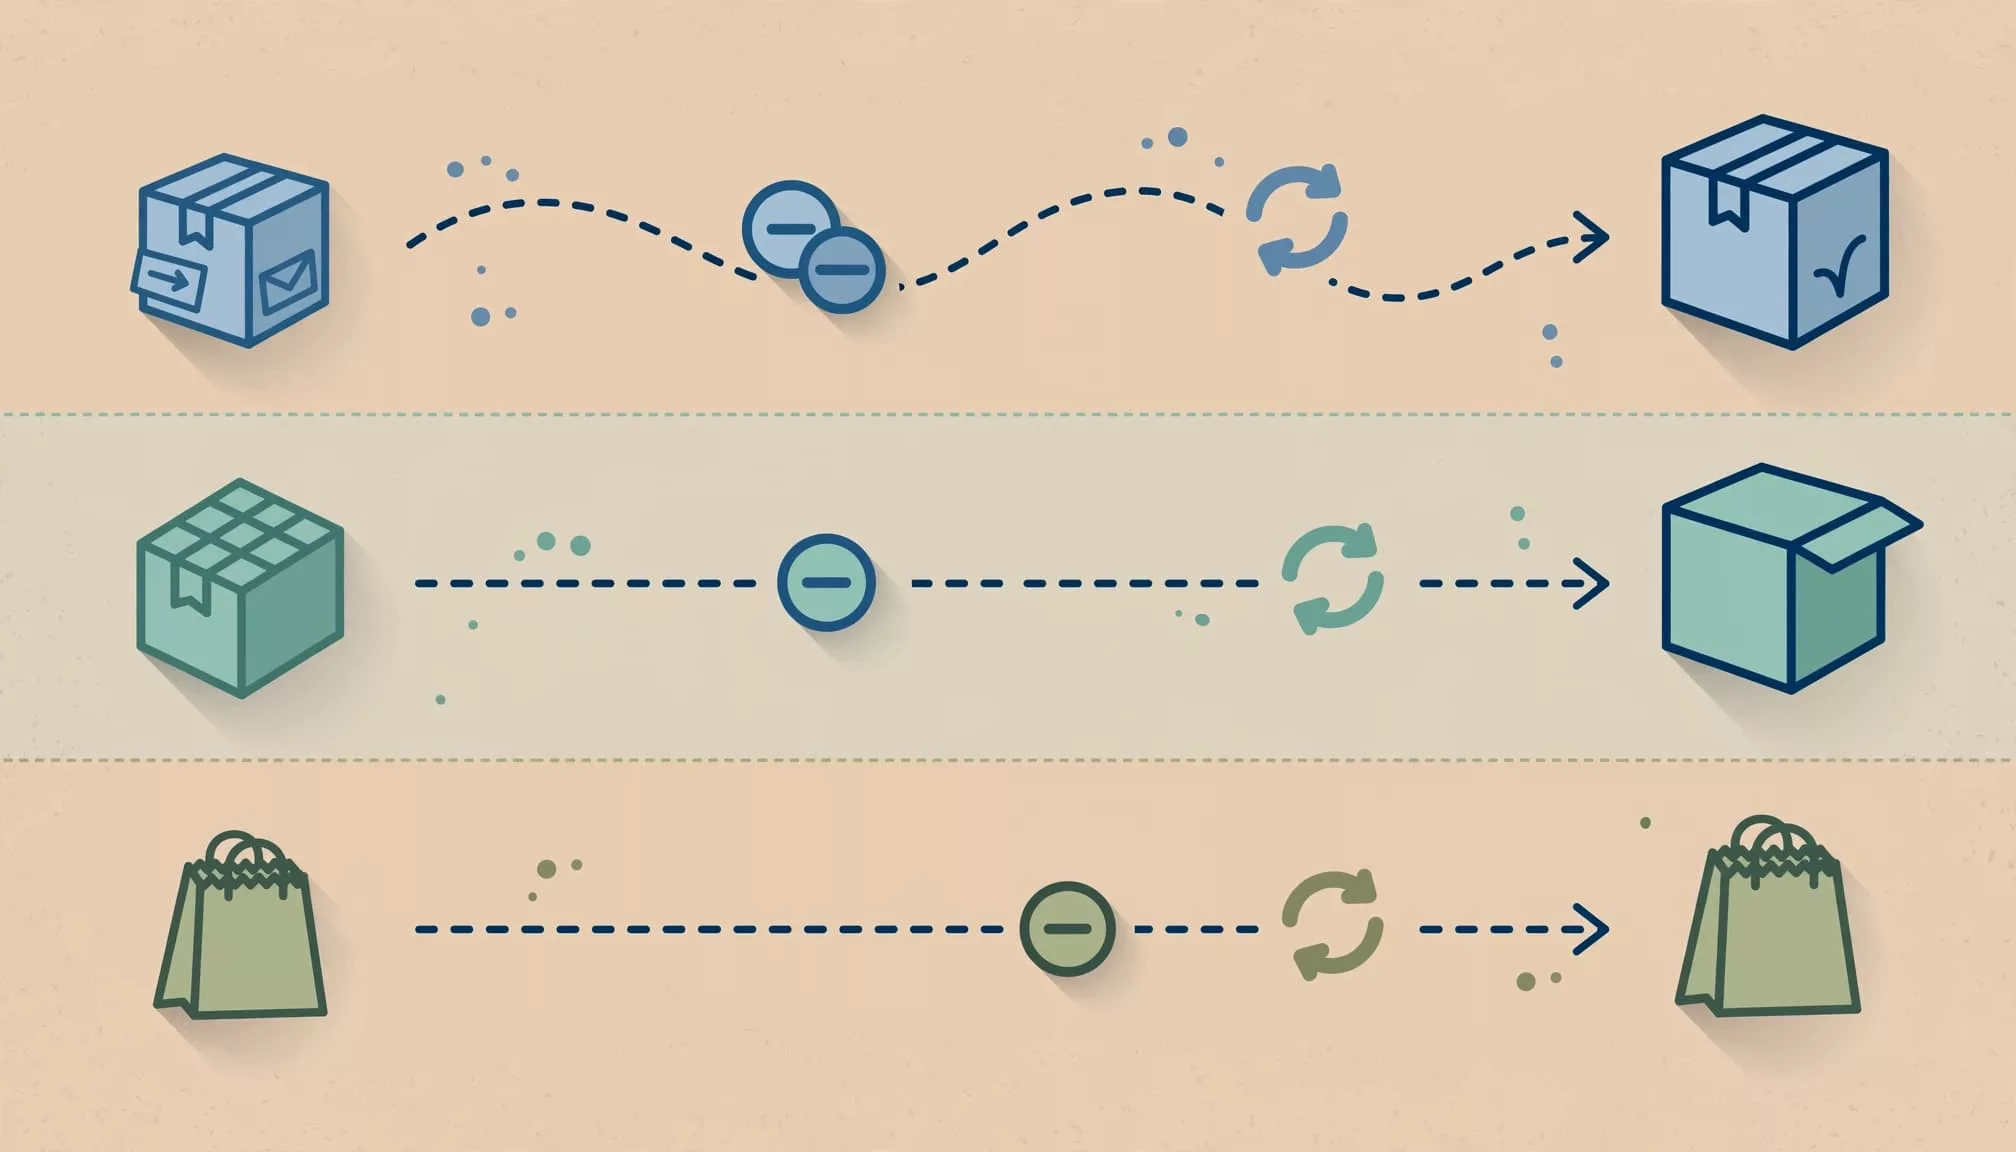
Reconcile each channel’s sales, discounts, refunds, and SKU quantities. Then assign COGS consistently and deduct channel-specific variable costs.
Our marketplace profitability calculator extends that comparison beyond merchandise margin.
Bank deposits aren’t a substitute for sales records. The Numbersmith’s explanation of profit after marketplace deductions highlights why payouts need reconciliation rather than direct treatment as revenue.
A favorable product mix can improve ecommerce gross margin and ecommerce profitability, even as payment, acquisition, and return costs reduce profit below merchandise margin.
What Is a Good Ecommerce Gross Margin?
There’s no universal healthy percentage. Category, pricing power, return behavior, and fulfillment requirements all affect what your store needs.
Shopify Community contributors have cited roughly 50% to 100% margins for luxury goods and 0% to 10% for low-priced commodities. These are anecdotal ranges, not official Shopify benchmarks. A true 100% gross margin would require zero COGS, so that upper endpoint isn’t a practical target for stocked merchandise.
The discussion also mentions around 40% or higher gross margin and 10% to 20% net margin. Treat these as contributor reference points, not established ecommerce averages.
For broader context, NYU Stern’s industry margin data separates gross, operating, and net margins by industry. Compare the closest product category rather than assuming all online retailers share similar economics.
Your working target should leave enough contribution to cover fixed expenses and your profit goal. A 40% gross margin can still be inadequate when acquisition, delivery, and returns are expensive. Compare against your own category and channel history using unchanged cost definitions.
Frequently Asked Questions
How do I combine gross margins across products?
Add gross profit dollars across products, then divide by their combined net sales. Don’t take a simple average of individual margin percentages.
Otherwise, a low-volume SKU receives the same weight as a bestseller. Use the same period, currency, and cost definitions throughout. This approach also works when combining channels, although separate contribution results remain useful.
What happens when net sales are zero?
Gross margin percentage is undefined because you can’t divide by zero. Report the gross profit or loss in dollars instead.
Keep fully refunded orders visible in returns reporting. Removing them entirely can make product and promotion performance look better than it was. Likewise, avoid treating a percentage based on negative net sales as a normal pricing signal.
Make Discounts Earn Their Place
Discounts reduce the money available to cover product costs before most operating expenses change. Calculate ecommerce gross margin from discounted net sales, then assess the contribution left after selling costs.
Before approving a promotion, compare its expected gross profit dollars with the full-price baseline. Higher order volume earns its place only when the resulting economics support the business.