
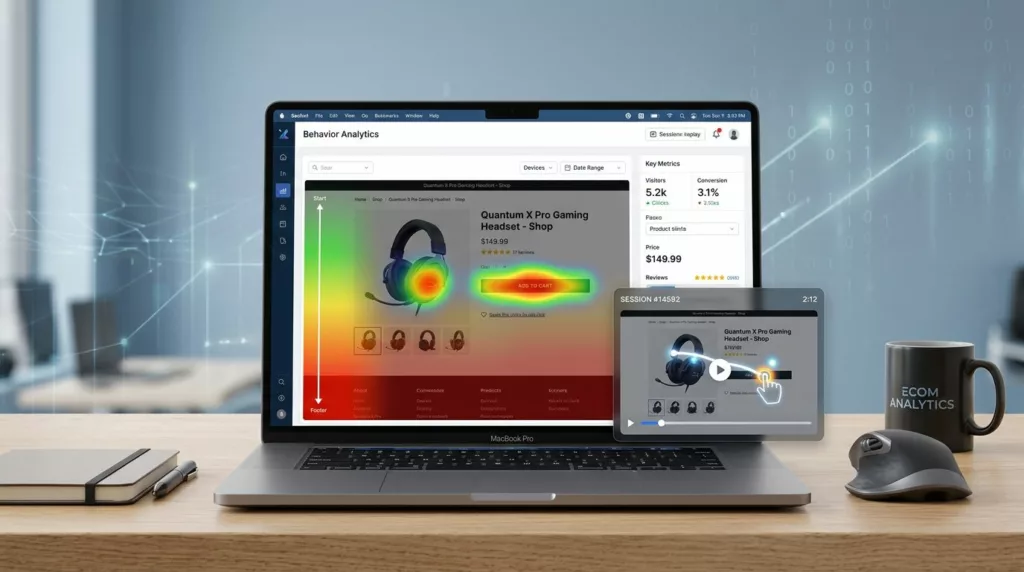

If conversion rate work feels like guessing, heatmap tools and session recordings change that fast. They show user behavior: where shoppers click, where they hesitate, and where they give up.
In 2026, the best teams don’t just watch recordings. They build a simple system: segment traffic, spot friction patterns, then ship focused tests.
Think of a heatmap like footprints in snow, it shows where people actually walked. Session replay is the security camera, it shows what happened right before the fall.
What heatmaps and session replays do well (and where they can mislead)
Heatmaps answer “where” questions. Click maps, also known as attention maps, highlight what gets attention, scroll maps show how far people reach, and move maps (in some tools) hint at reading behavior. For e-commerce, that’s perfect for product pages, collection pages, landing pages, and cart.
Session replays answer “why” questions. This qualitative data lets you see hesitation, mis-taps on mobile, repeated coupon attempts, back-and-forth between shipping and cart, and form errors that don’t show up cleanly in GA4’s quantitative data.
However, both can mislead without context:
- Heatmaps can over-weight high-traffic layouts and hide niche problems (like a broken variant picker only on iPhone).
- Replays can tempt you to “fix what looks annoying” instead of what hurts revenue.
- Sampling can skip the sessions you care about most, especially on high-traffic stores.
That’s why pairing behavior with outcomes matters. Many teams combine replays with funnels, error tracking, and Shopify events. If your digital experience needs a refresh first, this guide on optimize user experience in e-commerce for 2026 is a helpful baseline.
A replay is a clue, not a verdict. Treat patterns as evidence, then confirm with conversion data.
Best heatmap software and session replay tools for e-commerce in 2026 (comparison)
Most stores can start with one tool, then add a second only when there’s a clear gap (surveys, product analytics, deeper funnels, or team workflows).
Here’s a quick comparison of top heatmap software to narrow choices.
| Tool | Best for | Feature highlights | Starting price tier (2026) |
|---|---|---|---|
| Microsoft Clarity | Any store that wants a free baseline | Click and scroll heatmaps, session replay, rage clicks, dead clicks | Free |
| Hotjar | Small teams that want behavior plus feedback | Heatmaps, replays, on-site surveys, feedback widgets | Paid plans (entry) |
| Crazy Egg | Quick visual insights and simple experiments | Heatmaps, scroll maps, snapshots, A/B testing (plan dependent) | Paid plans (entry) |
| FullStory | Teams that need deep search and stronger analysis | Session replay, funnels, strong filtering, AI-assisted insights, behavior analytics | Custom quote (mid-market to enterprise) |
| Contentsquare | Enterprise UX and journey analysis | Zone-based heatmaps, journey mapping, error analysis | Custom quote (enterprise) |
| Heap | Product analytics plus behavior capture | Auto-capture event tracking, funnels, retention analysis, heatmaps (plan dependent) | Custom quote (mid-market) |
| FullSession | Replay-first teams that want faster prioritization | Session recordings, friction signals, privacy controls | Paid plans (entry) |
A few helpful starting points while you shortlist:
- For broader lists and categories, see Convert’s 2026 heatmap tools comparison.
- If you run Shopify and want a Shopify-native view of journeys and revenue, look at MIDA Analytics for Shopify customer journeys.
- If mobile web and mobile apps are a big part of your business, UXCam positions its stack around that use case (see UXCam product analytics for ecommerce).
A practical “use it weekly” playbook: segments, rage clicks, dead clicks
Tools don’t create wins, habits do. Set a weekly routine that forces focus on understanding user behavior throughout the user journey, otherwise you’ll collect session recordings and change nothing.
Start by segmenting before you watch anything. These four segments usually uncover the biggest differences in behavior:
- Device: desktop vs iOS Safari vs Android Chrome. Mobile friction hides in plain sight.
- Traffic source: paid social, paid search, email, organic. Each arrives with different intent.
- New vs returning: new visitors need clarity, returning visitors need speed.
- High-intent pages: product pages, cart, checkout, and your top landing page per campaign.
Next, hunt for frustration signals, then group these friction points by “same cause”:
- Rage clicks: repeated clicks on the same element, often caused by slow responses, disabled buttons, or confusing UI states.
- Dead clicks: clicks on non-clickable elements (like a product image that looks tappable but isn’t).
- Excess scrolling: users “searching” for info you buried, often shipping, sizing, returns, or trust cues.
- U-turns: back navigation between product and cart, usually a surprise cost or uncertainty.
On Shopify themes, one common dead-click area is the product page CTA region on mobile. If you’re seeing missed taps or scrolling past the button, compare your layout to proven mobile add-to-cart button design patterns.
Fix checkout friction, then turn findings into A/B tests (without slowing your site)
Checkout is where small issues get expensive. Use replays, heatmaps, and funnel analysis to isolate where shoppers lose momentum and identify drop-off rates, then confirm with funnel drop-off.
Checkout friction checklist that works across Shopify, WooCommerce, BigCommerce
Look for these patterns in batches of 20 to 50 relevant sessions per segment:
- Coupon code obsession: people leave checkout to search for codes. Consider an auto-apply promo, clearer messaging, or removing the field earlier.
- Shipping surprise: rage clicks near shipping methods, or repeated edits to address fields. Add shipping estimates earlier (product page or cart).
- Form churn: repeated focus on one field, often phone, state, or address line 2. Fix validation timing and error copy.
- Payment failure loops: repeated attempts, then exit. Check wallet support, error clarity, and third-party scripts.
Turn recordings into clean A/B test briefs
Use this simple structure so your team stops arguing about opinions and gains actionable insights for conversion optimization:
- Observation: “Returning mobile users rage click ‘Pay now’ after selecting Shop Pay.”
- Hypothesis: “The button looks disabled during loading, so users think it failed.”
- Change: Add a visible loading state, lock double taps, and move error text above the fold.
- Primary metric: checkout completion rate (segment: returning mobile).
- Guardrails: page speed, payment error rate, revenue per session, support tickets.
If you need help choosing what else belongs in your optimization stack, this roundup of best ecom tools to boost 2026 sales can help you map gaps (testing, email, analytics) without buying duplicates.
Performance and data governance (don’t skip this part)
Session replay scripts can add weight. Keep performance steady by loading tags asynchronously where possible, sampling replays on high-traffic pages, and excluding internal traffic (staff, agencies). After changes, re-check Core Web Vitals, because even “small” scripts stack up.
Privacy work should be planned, not patched later.
Mask sensitive dynamic elements by default (emails, phone numbers, addresses, payment fields), then allow access only to the people who truly need it.
Also set clear rules for consent (cookie banner behavior), retention (Clarity is commonly referenced with short retention windows), and who can export data. If your store handles regulated data, confirm vendor terms, DPAs, and controls before rolling out to all pages. Tools like FullSession’s replay and privacy controls highlight this balance between insight and compliance.
Conclusion
Heatmaps show where shoppers focus, session recordings show what went wrong, and together they make CRO work less emotional. Start with one tool, segment your traffic, and review sessions on a schedule. Then ship small tests tied to revenue steps with revenue attribution, especially product pages and checkout. When you treat heatmap tools and behavior analytics as a core workflow for the team, not a dashboard, improvements stop being random and start compounding.