

For online stores, ecommerce organic traffic can drop when search demand, visibility, click-through rates, or measurement changes. Identify the first metric that changed before rewriting pages or changing your SEO strategy.
Fewer Google clicks, fewer analytics sessions, and fewer purchases point to different problems. Your first job is to isolate the decline, then connect it to affected pages and recent changes.
Key Takeaways
- Compare Search Console clicks and impressions with analytics sessions before assuming rankings fell.
- Segment losses by landing page, query, device, and country. Store-wide averages can hide one broken template.
- Prioritize tracking failures, indexing blocks, and high-revenue landing pages before publishing more content.
1. Establish Your Ecommerce Organic Traffic Baseline
Separate search clicks from analytics sessions
Organic traffic means visits through unpaid search results. In Google Analytics 4 (GA4), open Traffic acquisition and use Session default channel group, filtered to Organic Search. This separates organic sessions from Direct, Referral, and Paid Search.
Google’s channel definitions include non-ad links in AI Overviews and AI Mode under Organic Search. However, visits classified as Organic Shopping belong to a separate channel.
Search Console measures Google Search activity; GA4 measures activity after visitors arrive. Consent choices, blocked scripts, and loading failures can affect GA4 without changing Search Console clicks. The totals shouldn’t match exactly.
Choose comparable dates and segments
Compare complete periods with matching weekdays, then compare against the previous year for seasonal categories. Exclude incomplete reporting days.
Export clicks, impressions, sessions, purchases, and revenue by landing page. Separate branded queries from non-branded queries, then compare countries and devices.
Finally, mark migrations, theme releases, consent changes, promotions, social media campaigns, and stockouts on the timeline. Campaign timing can help explain referral activity, but it doesn’t by itself establish a change in search demand. Keep deployment records through at least one full recrawl and business cycle. A sudden drop following a release deserves investigation before broader content changes.
2. Use Traffic Statistics Without Treating Them as Targets
Broad-web benchmarks commonly put organic search near 53% of website traffic, with combined organic and paid search near 68% of trackable traffic. Treat that organic traffic share as context, not a target. A benchmark percentage alone doesn’t establish a competitive advantage.
Opensend’s ecommerce statistics report organic search generating 31% of revenue, compared with paid search’s 36% from 23% of traffic. The roundup also reports email producing 9.6% of sales from 4.4% of traffic.
Those numbers describe channel efficiency, but they don’t form one consistent dataset. Samples, attribution methods, and reporting periods vary, including how social media receives credit, so direct comparisons can mislead.
The same caution applies to the frequently quoted 14.6% organic lead conversion figure. A lead conversion rate isn’t interchangeable with completed ecommerce purchases.
Likewise, reported ecommerce organic growth of approximately 23% between February 2020 and February 2022 describes a historical period. It doesn’t establish a normal annual growth rate.
Compare your organic traffic share and paid traffic mix with your own revenue, purchase conversion, and contribution margin data. These measures matter more than matching an industry traffic percentage.
3. Identify Whether Impressions, Rankings, or Clicks Fell
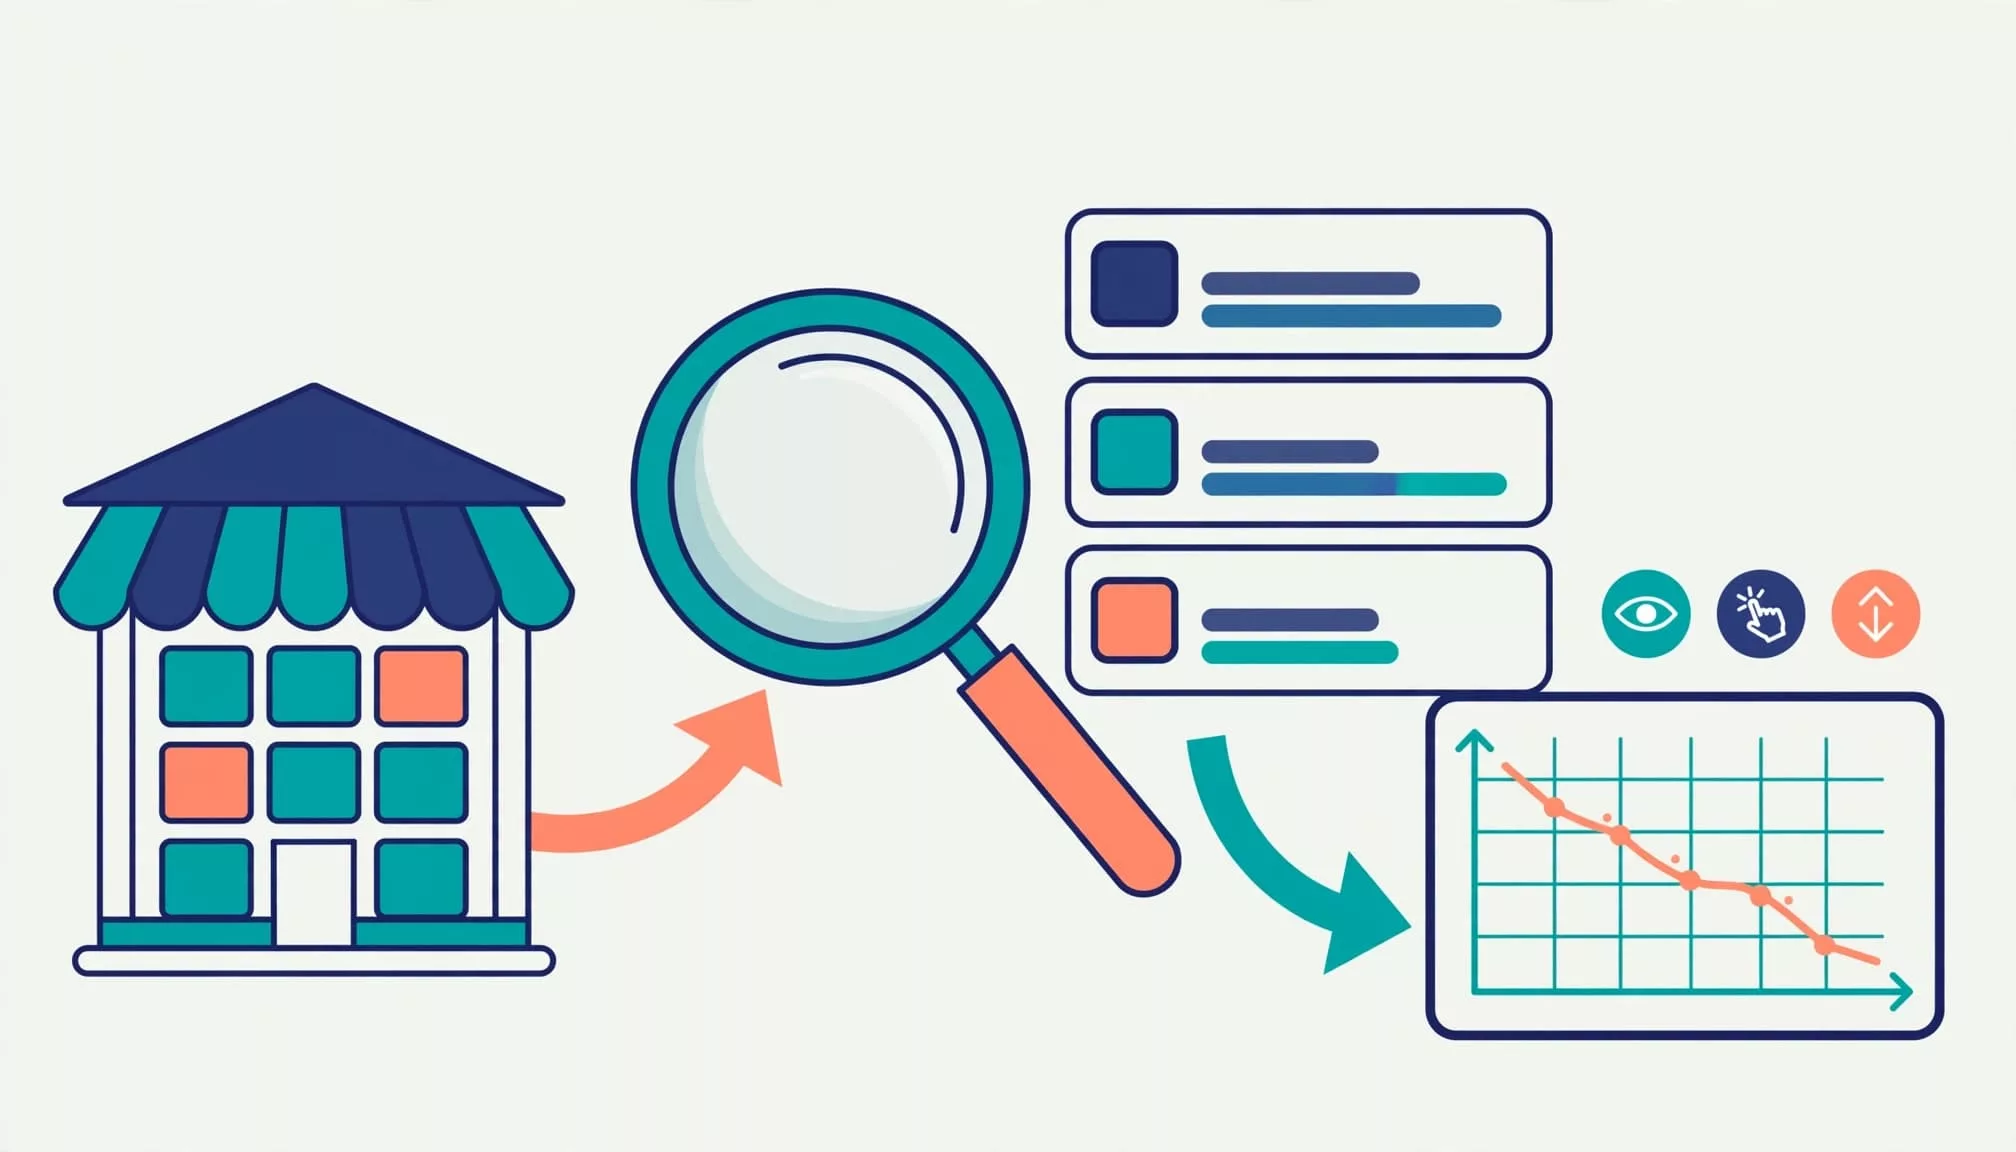
In Search Console, compare periods with clicks, impressions, click-through rate (CTR), and average position enabled. Google’s metric definitions explain what each measures.
Use these patterns to choose your next investigation.
| Observed pattern | Likely direction | First check |
|---|---|---|
| Impressions fall; positions stay similar | Lower demand or narrower visibility | Query trends and indexed pages |
| Positions worsen; clicks fall | Ranking loss | Affected query-page pairs |
| Impressions hold; CTR falls | Less attractive results or changed layouts | Titles and search features |
| Clicks hold; GA4 sessions fall | Measurement or arrival problem | Consent, tags, and loading |
The pattern narrows the diagnosis; it doesn’t prove the cause.
Impressions down: separate demand from visibility
Filter to the pages losing the most clicks. Then inspect their queries individually, including long-tail keywords, because site-wide average position changes with query mix.
If indexed pages and positions remain stable, compare demand in Google Trends. Use keyword research to check whether query demand or your coverage has changed.
If URLs disappeared, use URL Inspection to examine indexing status, Google’s selected canonical, and crawl access.
Clicks down: inspect rankings and search results
Smart Insights’ CTR roundup lists 39.8% for position one, 18.7% for position two, and 10.2% for position three. Top-three share estimates also exceed 54%, although methods differ.
Small changes in search engine rankings can therefore affect clicks substantially. However, stable rankings with lower CTR suggest another cause, such as extra ads, shopping results, AI Overviews, or less compelling titles.
Inspect the affected searches in the relevant country and device context. Review titles and meta tags alongside the search results, since changes to result presentation can also affect CTR.
4. Audit Technical Changes and Internal Links
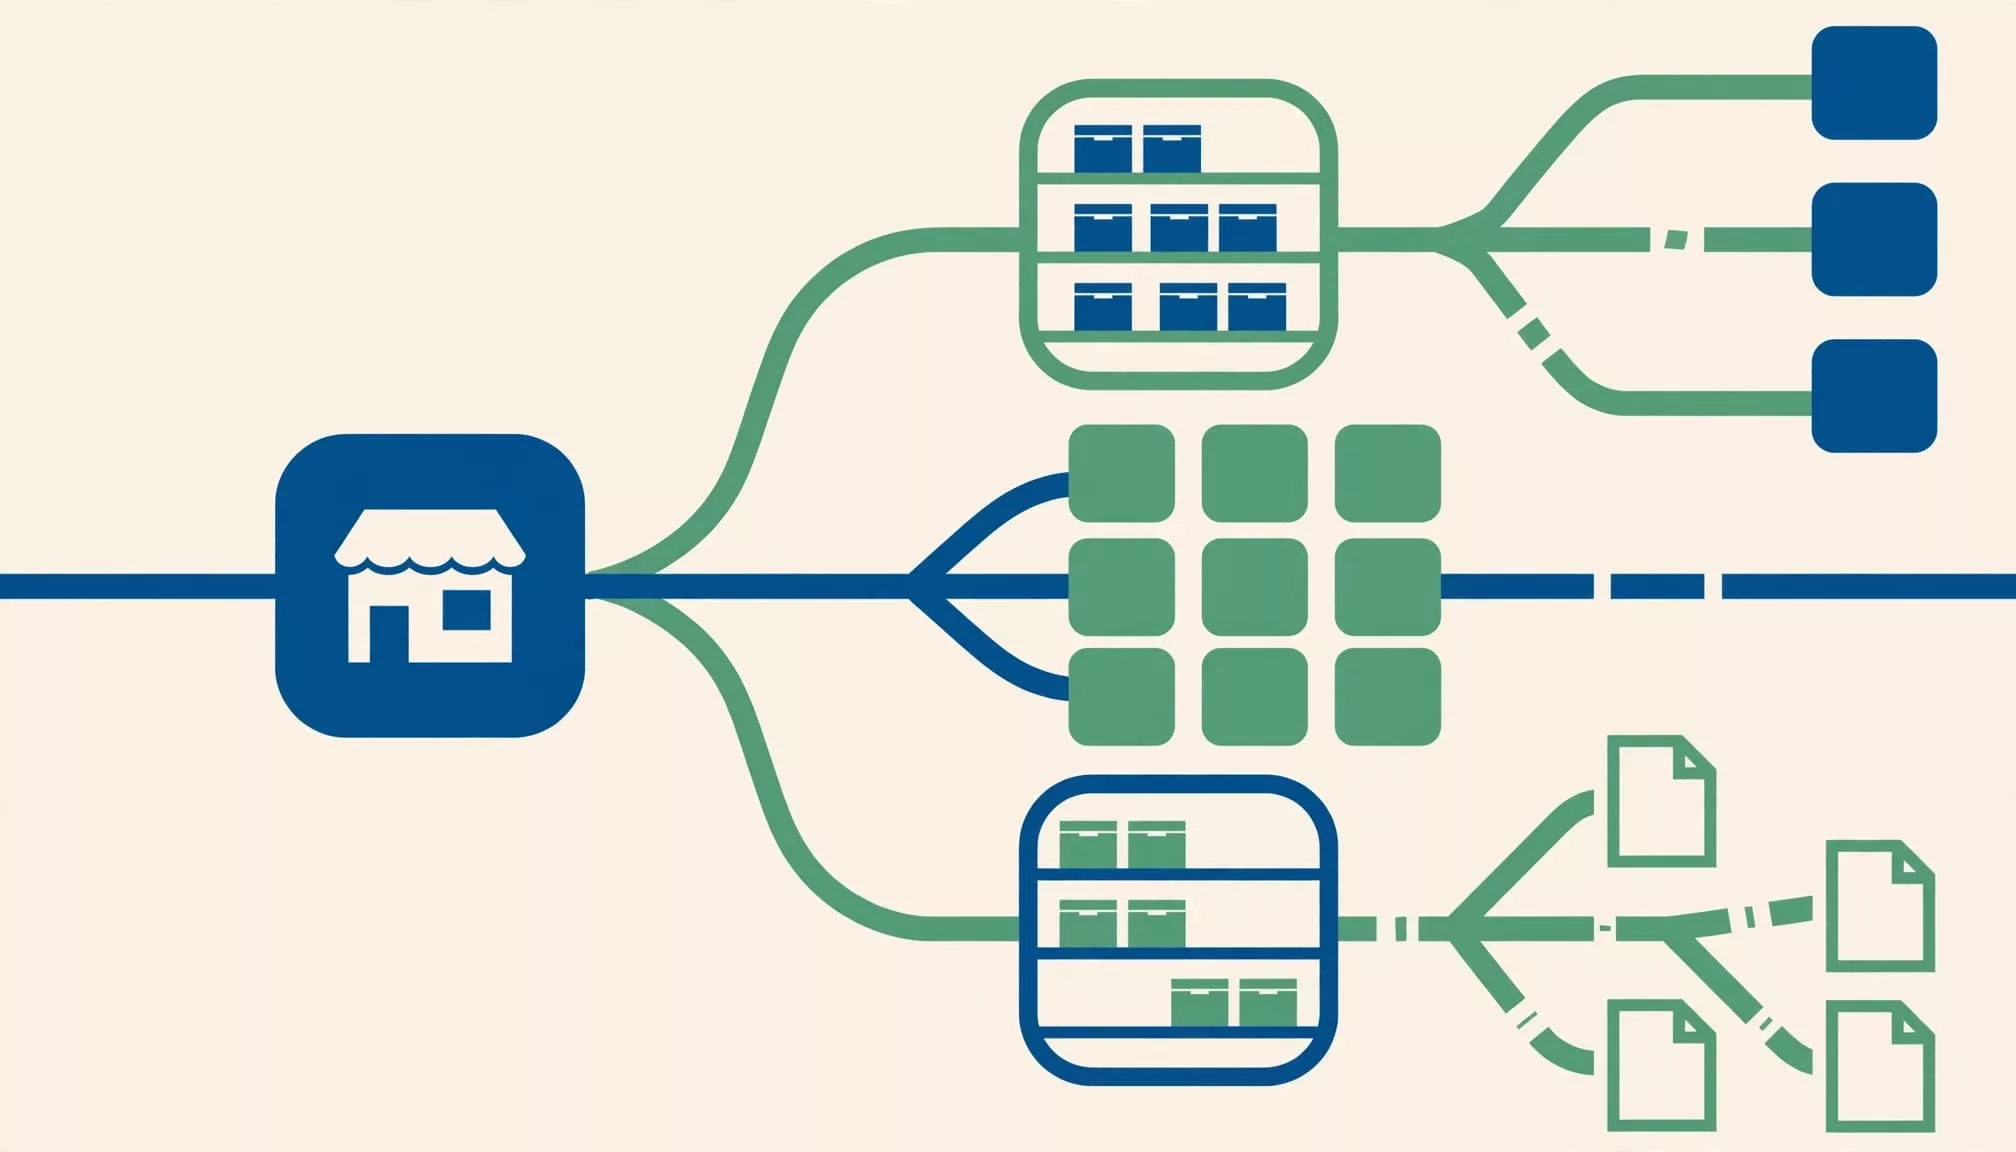
Inspect indexability and canonical signals
Run these technical SEO checks on affected URLs for accidental noindex directives, robots.txt blocks, server errors, redirects, and conflicting canonicals.
On Shopify, inspect a base product, collection-path product, variant URL, filtered collection, and paginated collection. Compare rendered output with Google’s selected canonical. Theme changes and apps can introduce duplicate tags.
Our Shopify canonical troubleshooting guide explains these URL relationships. Canonicals suggest a preferred duplicate, redirects move visitors, and noindex excludes pages from search.
Blocking a URL in robots.txt can prevent Google from seeing its noindex directive. Crawl control and index removal require different decisions.
Restore discovery paths and control URL expansion
Crawl the store with Screaming Frog or Sitebulb. Compare internal links, status codes, canonical targets, and sitemap entries against the pre-release inventory.
Reboot Online reports that 62.4% of ecommerce websites in its 2025 data had broken links. Its roundup also reports 86% of brands lacking optimized internal links. These findings justify checking links, not assuming they’re your cause.
Products can lose visibility after collection rules, navigation, or pagination changes remove their links. Our orphan product page audit distinguishes disconnected products from pages buried too deeply.
Also inspect parameter growth. Millions of thin filter, sort, and internal-search URLs can create unnecessary crawl paths. Keep valuable landing pages accessible while controlling low-value URL generation.
5. Review Category and Product Pages Against Search Intent
Diagnose category-level losses
Group declining URLs by template, including Shopify’s /collections/ and /products/ paths. A collection-wide decline after a filter-app release suggests a different investigation than losses across unrelated products.
For the largest lost queries, compare competing results’ page types, assortment, availability, and buying information. Search engines can reveal whether collections, products, or buying guides now satisfy the query. Compare result formats, including video content, and note distinctive assortment or buying details that give a competitor a competitive advantage.
Map broad product-type searches to useful categories. These searches often show broad purchase intent, while exact-model searches usually need detailed product pages. Avoid sending both intents to one generic destination.
Improve useful pages before deleting them
Missing compatibility details, unclear delivery terms, and repeated manufacturer product descriptions can weaken search relevance and purchasing confidence. Improve commercial pages before expanding with blog posts.
Ahrefs’ historical study found 90.63% of sampled pages received no estimated Google organic traffic. That isn’t a deletion rule for your catalog.
Choose a product page or collection based on purchase intent, query wording, and available products. Preserve pages with inventory, backlinks, recurring impressions, or a clear commercial role. After consolidations, watch surviving URLs for lost queries and cannibalization. If the replacement performs worse, revise the destination or restore the previous page while reversal remains practical.
6. Separate Traffic Loss From Conversion Loss
If clicks and sessions remain stable but purchases fall, investigate the shopping experience before changing SEO.
Compare product views, add-to-cart rate, checkout starts, purchase conversion, and revenue per organic session. Segment results by device, including mobile devices, and by country, category, and new versus returning visitors.
Statista reports that mobile traffic accounted for more than half of global web traffic in the first quarter of 2026. Historical Google research also found 53% of mobile visits were abandoned when loading exceeded three seconds. These benchmarks support investigating mobile performance, but don’t establish your store’s cause.
Check page speed on affected landing pages and confirm the experience is mobile-friendly. Place a test order on mobile devices. Confirm that purchase events fire once with the correct transaction ID and revenue. Then investigate stockouts, delivery charges, payment failures, and discount mismatches.
Our ecommerce funnel analysis guide helps locate those leaks. A lower purchase count requires different fixes than fewer search impressions.
Frequently Asked Questions
Can AI Overviews reduce ecommerce organic traffic?
Yes. AI answers and other search features can reduce clicks even when visibility remains stable. Safari Digital’s roundup reports AI Overviews on 3.2% of shopping queries, but that estimate doesn’t describe every store’s query mix.
Research on AI Overview CTR provides broader context. Compare informational guides separately from product and collection pages, rather than attributing every decline to AI.
Should you publish 16 blog posts monthly to recover?
No fixed publishing quota repairs lost traffic. HubSpot’s blogging research reported almost 3.5 times more inbound traffic among companies publishing at least 16 blog posts monthly than lower-frequency publishers.
That association doesn’t prove volume caused growth or establish an ecommerce recovery target. Fix inaccessible pages and weak commercial landing pages before increasing output.
Does a Google update explain a sudden decline?
An update can coincide with ranking losses, but timing alone doesn’t establish causation. Compare affected queries, templates, and countries with deployment records.
First rule out tracking failures, indexing mistakes, and seasonal demand. Then assess whether competing pages better satisfy the searches you lost.
Conclusion: Prioritize Troubleshooting by Evidence
Recovering ecommerce organic traffic starts with finding the first metric that changed. Rank potential SEO fixes using evidence from affected pages.
Work through this checklist in order:
- Confirm complete reporting periods, comparable dates, and the correct GA4 channel. Separate tracking changes from genuine session losses.
- Compare clicks, impressions, CTR, and rankings in Search Console. Identify whether the decline starts with visibility or clicks.
- Isolate the largest losses by page, query, device, and country. Prioritize commercially important categories and products by potential return on investment.
- Inspect recent deployments, crawl access, noindex directives, canonicals, redirects, server errors, and missing internal links.
- Review demand and competing results before changing content. Match each affected query to the right landing-page type.
- Test mobile purchasing and analytics events when sessions hold but purchases decline. Release targeted fixes, record deployment dates, and monitor affected segments against the baseline.